C-2022-001-2WE
In an article translated from the Foundation's CSR White Paper 2022, environmental economist Suk Sunhee explains the mechanism and benefits of carbon pricing as a policy tool in the fight against global warming, drawing on her studies of South Korea’s emissions trading scheme.
* * *
The American economist Milton Friedman, winner of the 1976 Nobel Prize, argued that the one and only social responsibility of business is to increase profits while operating within the rules of the game. Thanks in part to his influence, the quest for corporate profits has become the cornerstone of business policy, practice, and education. Moreover, it is widely acknowledged that achieving this aim delivers important benefits to society as a whole, including economic buoyancy and job creation.
Nonetheless, in a world grappling with such problems as climate change and large-scale environmental destruction, there is a growing awareness that businesses must also steer their activities in directions that contribute to the betterment of society as a whole. Both external stakeholders (including government, domestic and foreign business partners, financial institutions, consumers, and social-sector organizations) and shareholders are demanding that businesses assume an unprecedented level of responsibility for the development of a sustainable society.
The problem of climate change has taken on particular urgency. What was once treated as an environmental concern is now recognized as a global crisis threatening our very existence. In response, many countries are accelerating the commitments and countermeasures they adopted under the Paris Agreement. Companies, for their part, have begun to address climate change as a major business risk, while also facing the need to respond to changing government policies.
In this paper, I focus on the policy tool known as carbon pricing. In the following, I hope to shed some light on the mechanism of carbon pricing and its impact on business, with particular emphasis on the example of South Korea.
Spread and Anticipated Benefits of Carbon Pricing
While many countries have signed the Paris Agreement and agreed to its maximum global temperature-increase target, there is still a great degree of uncertainty as to whether they can back their commitments with domestic legislation and reduce emissions within the prescribed time frame. What we can say, however, is that all the developed countries and most of the emerging economies are stepping up policy measures aimed at reducing greenhouse gas (GHG) emissions. Conspicuous amid this trend is the growing use of carbon pricing, which leverages the market mechanism to reduce emissions. Of the 196 countries that adopted the Paris Agreement in December 2015, more than half that have submitted climate action plans, called nationally determined contributions (NDCs), have committed to the use of carbon pricing. As of 2021, 46 countries and 32 regions had already adopted either carbon taxes, emissions trading schemes, or both (World Bank 2022).
The past few years have witnessed the global expansion of carbon markets, thanks in part to China’s launch of a nationwide emissions trading scheme, or ETS, in 2021. And in the European Union and the United States, there has been serious talk of levying a border adjustment tax on imports from regions with lax carbon emissions standards. Such trends have heightened global awareness of carbon pricing, and more countries are expected to adopt similar schemes going forward.
There is widespread agreement among economists that economy-wide carbon pricing is a vital (although not necessarily sufficient) element of any package of policies to achieve GHG reductions in a cost-effective manner. Environmental economists explain its efficacy as follows: By attaching a price to GHG emissions, carbon pricing allows the market to deal with the negative costs, or externalities, of GHG emissions, thus functioning to internalize such externalities (Kuriyama and Managi 2020). In addition, well-designed carbon-pricing schemes give businesses and other emitters an economic incentive for setting reduction targets, building organizational frameworks, and investing in low-carbon and decarbonization technologies in a bid to reduce costs (CPLC 2021). Such schemes thus have the potential over the long term to drive cost-effective reductions in GHG emissions throughout society.
But how should carbon be priced, and at what level? In the next section, I will review some of the options available.
Setting the Price of Carbon
How is the price of carbon set? There are many different approaches, including (1) cost-benefit analysis to calculate the social cost of carbon emissions, (2) estimation of the price required to reach climate goals, (3) establishment of tax rates by the government (in the case of a carbon tax) or market pricing of emission allowances (in the case of an emissions trading scheme), and (4) internal carbon pricing, in which businesses and other entities assign their own price. Here, I would like to compare approaches (2) and (3).
Carbon price needed to meet climate goals
Under this approach, the price of carbon is the estimated cost of policies to stay within the temperature-increase target of the Paris Agreement or to reach a given country’s target for net-zero GHG emissions. For example, according to the Intergovernmental Panel on Climate Change (IPCC) special report Global Warming of 1.5°C, estimates for a below-1.5°C pathway range from 135 to 6,050 USD per ton of CO2 (equivalent) in 2030 and 690–30,100 USD/tCO2 in 2100 (Rogelj et al. 2018, 93–174). In the June 2021 Staff Climate Notes, published by the International Monetary Fund, the authors argue that additional mechanisms will be needed to keep within the temperature target of the Paris Agreement and propose an international carbon price floor (ICPF) among large carbon emitters, with countries paying from 25 to 75 USD per excess ton, depending on their level of economic development (Parry, Black, and Roaf 2021). Summarizing previously published research, Liu and Murun (2022) write that keeping the rise in global temperature to 1.5°C will entail immediately setting the price of carbon emissions at 30 USD/tCO2, raising it to 80–150 USD by 2030, and pushing it up to around 400 USD between 2050 and 2100.
In Japan, meanwhile, a 2018 analysis using a macroeconometric model estimated that the carbon prices needed for the nation to achieve the 2030 target (26% reduction from the 2013 level) and 2050 target (80% reduction) set by the government’s 2016 Plan for Global Warming Countermeasures were roughly 11,400 JPY/tCO2 in 2030 and about 57,300 JPY/tCO2 in 2050 (Kojima et al. 2018). A recent study estimated that the carbon prices required for Japan’s recently revised targets of a 45% reduction by 2030 and carbon neutrality by 2050 are 215 USD/tCO2 and 670 USD/tCO2, respectively (Suk et al. 2022).
The carbon prices needed to meet specific targets should not be confused with the prices established by policy instruments, such as carbon taxes and emissions trading schemes. The prices needed to meet the targets are generally higher.
Carbon taxes and emissions trading schemes
The two standard policy tools for carbon pricing are carbon taxes and emissions trading schemes. A carbon tax puts a direct price on carbon content (which ideally should be levied upstream, where fossil fuels enter the economy, such as mines, oil wells, and points of import). In this case, the price of carbon is set by the government in the form of tax rates. An ETS, meanwhile, caps the amount of carbon that enters the economy, allocates allowances to emitters, and creates a carbon market where those allowances can be traded. In this case, the market sets the price of carbon. If one excludes the uncertainty factor, the two systems have equivalent emissions reduction effects, regardless of whether the point of regulation is upstream (carbon content of fossil fuels), midstream (electric power generation), or downstream (electricity use) (Stavins 2022).
Figure 1. Carbon Tax Rates by Country (year of introduction)
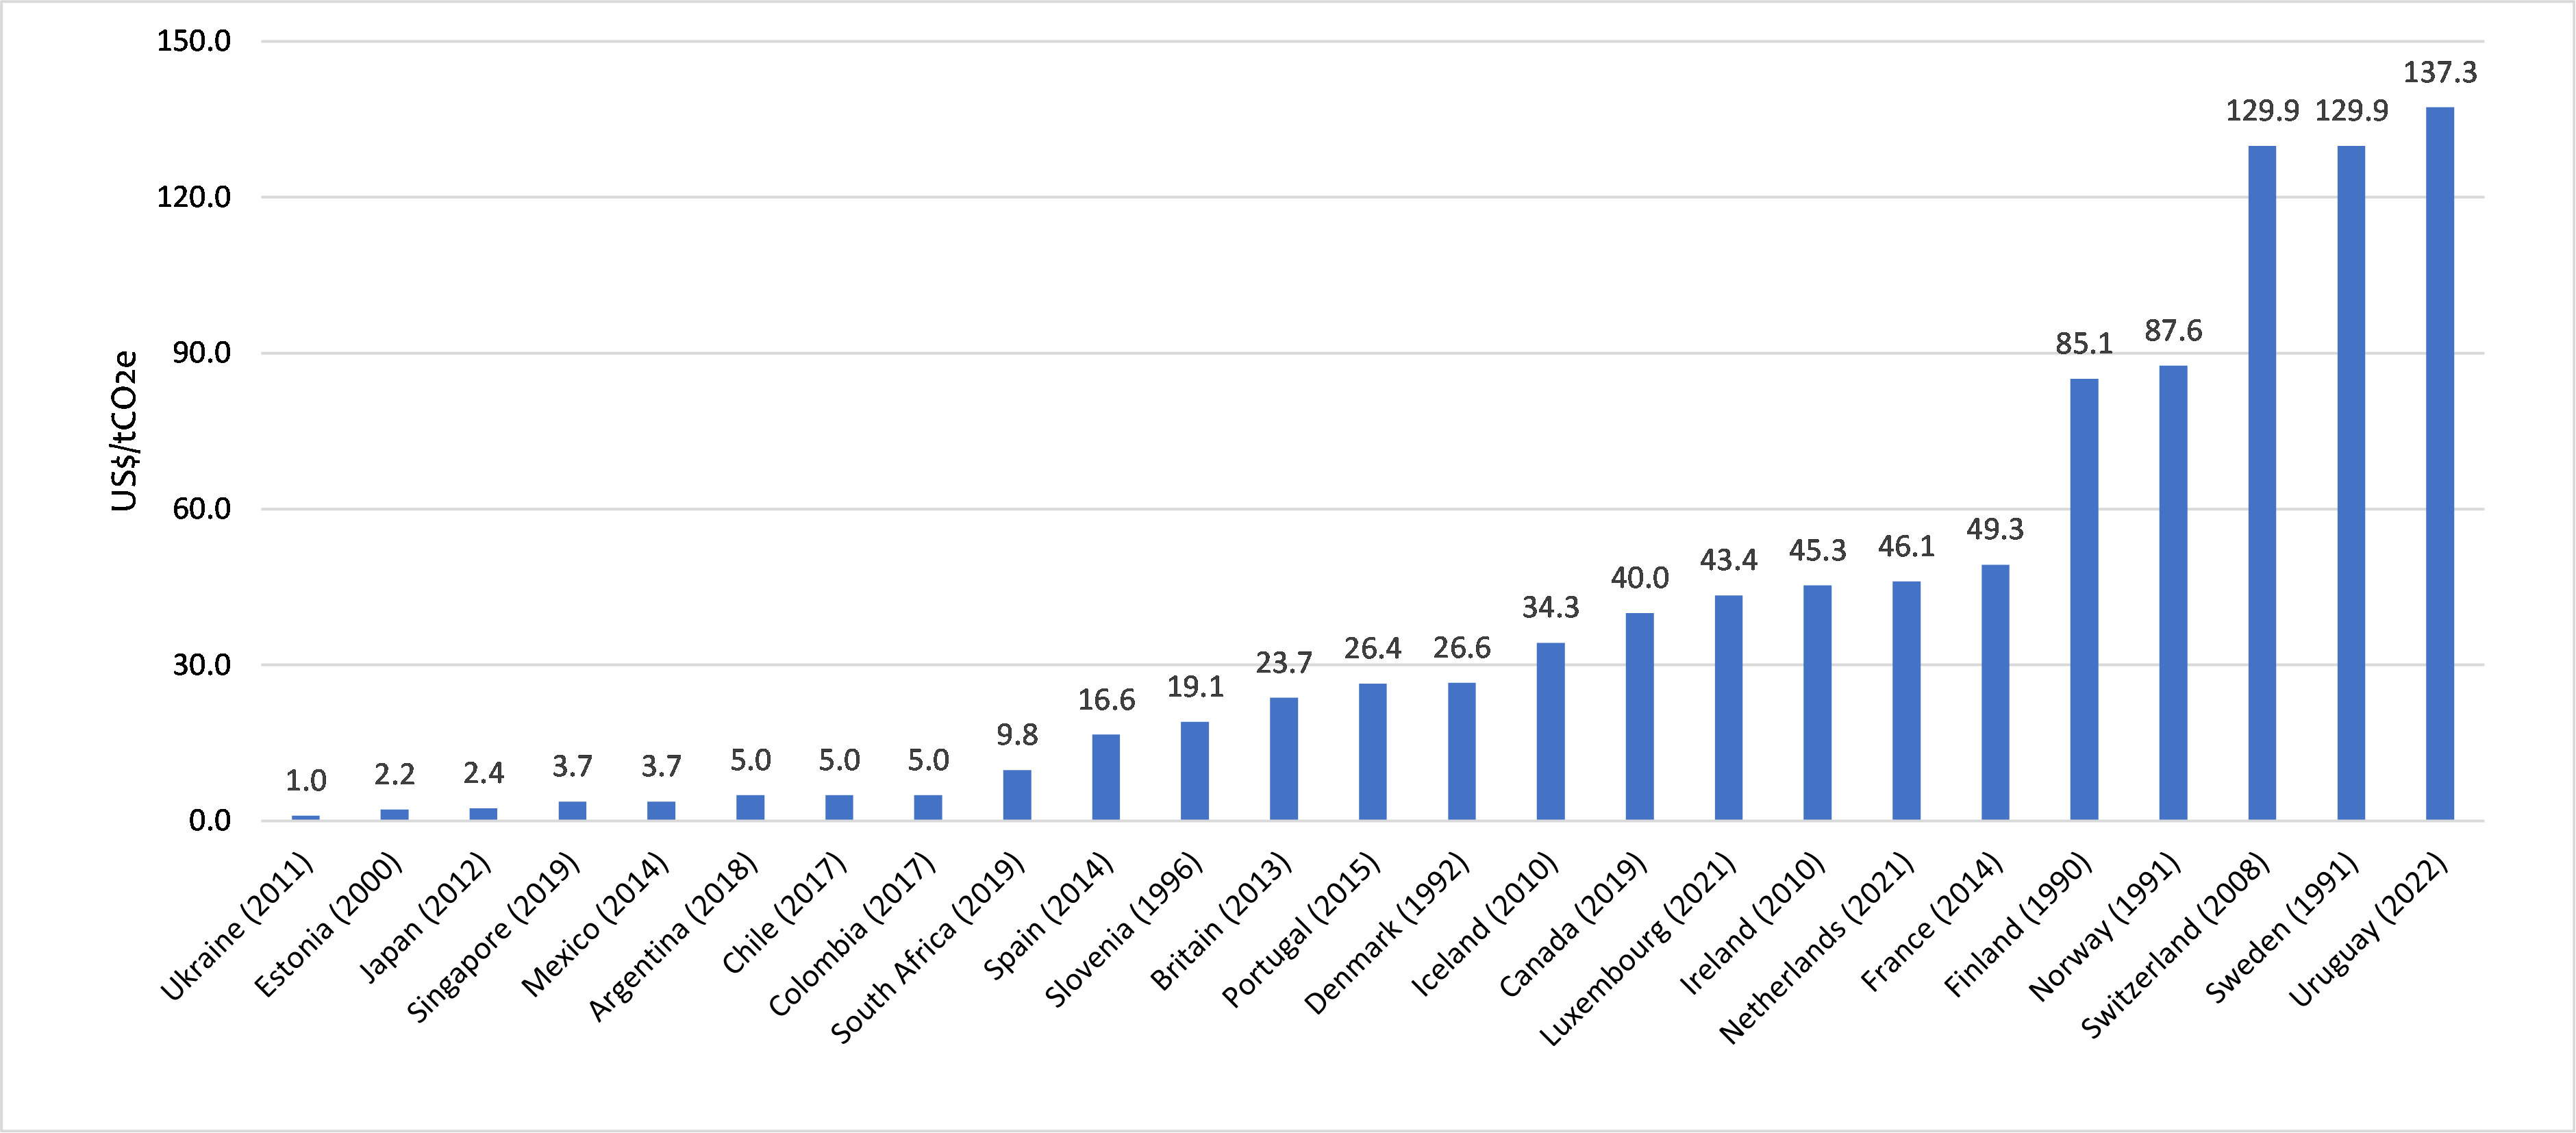
Source: Created by the author based on World Bank data, https://carbonpricingdashboard.worldbank.org/map_data.
Note: Tax rates are current as of April 1, 2022. For countries where tax rates vary by sector or fuel (including Denmark, Finland, Iceland, Ireland, and Luxembourg), the highest rate is shown.
Finland introduced the first carbon tax in 1990. As of April 2022, a carbon tax was in effect in 37 countries around the world. According to the World Bank, almost all carbon taxes today are levied on fossil fuel consumption. Countries differ as to the scope of application, including the sectors (heating, transportation, waste disposal, etc.) and types of fuel (coal, oil, gas) covered. Many European countries combine a national carbon tax with the EU Emissions Trading System.
As seen in Figure 1, carbon tax rates today range widely, from around 1 USD to roughly 137 USD/tCO2. In October 2012, Japan instituted a Global Warming Countermeasures Tax designed to limit carbon emissions from energy sources. The tax rate was raised incrementally, reaching its final rate of 289 JPY/tCO2 in 2016.
Emissions trading is a GHG reduction mechanism provided for in Article 17 of the Kyoto Protocol. Under an ETS, the government allocates emission allowances to business sites, which may emit greenhouse gases within those limits. It also permits businesses to buy and sell allowances, so those with a shortfall can acquire allowances from others with a surplus. As of the end of 2021, emissions trading schemes covered more than a third of total GHG emissions in jurisdictions with net-zero targets, some of which view emissions trading as their primary means of achieving carbon neutrality (ICAP 2022). Under an ETS, which creates a carbon market, the carbon price is the market price and thus fluctuates according to the supply and demand of allowances.
The world’s first international emissions trading scheme was the European Union Emissions Trading System, or EU ETS, launched in 2005. All EU countries as well as Iceland, Liechtenstein, and Norway (EEA-EFTA countries) participate in the scheme, which is now in phase 4 (2021–30). The EU ETS covers emissions from around 10,000 installations in the power and manufacturing sectors, as well as airlines operating between the participating jurisdictions, accounting for about 40% of the EU’s total GHG emissions.
During the first year of the EU ETS, the average price of emission allowances (European Union Allowances) was 21.8 EUR/tCO2, but an oversupply of allowances led to a drop in market prices, which averaged 0.7 EUR in 2007. Average allowance prices later recovered to around 20 EUR but then fell year by year, trading in a range of 4.3 to 7.3 EUR in the period from 2012 to 2017. Thereafter, the EU actively adjusted emissions quotas. In addition, it introduced the Market Stability Reserve (MSR) and implemented backloading (postponement of allowance auctions) to minimize the market impact of Britain’s withdrawal from the EU. As a result, the average market price rose from 5.8 EUR in 2017 to 15.5 EUR in 2018, 24 EUR in 2019, and subsequently soared to almost 90 EUR in January 2022. It plummeted briefly in February 2022 as a result of the war in Ukraine but has since rebounded to more than 80 EUR.[1], [2]
China’s national carbon trading scheme is the world’s largest in terms of emissions covered (an estimated 4.5 billion tCO2). The system was launched on July 16, 2021, and applies almost exclusively to the electric power sector, covering 2,225 installations. The market price started at 48.00 CNY (7.44 USD) and rose gradually. By the end of December 2021, the cumulative trading volume was 179 million tons for a total trading value of 7.66 billion CNY (1.2 billion USD). The closing price on December 31, 2021, was 54.22 CNY (8.40 USD), up 12.96% from the July opening price (ICAP 2022).
South Korea’s Korea Emissions Trading Scheme, or K-ETS, was the first nationwide cap-and-trade program in Northeast Asia upon its launch in 2015, and is now the world’s second largest national carbon market after China’s ETS. Covering about 70% of domestic GHG emissions, it is the linchpin of South Korea’s national campaign to stem climate change. Now in its third phase (2021–25), K-ETS covers six sectors (power, industry, buildings, transport, waste, and public sector), with at least 10% of allowances sold through auction (as opposed to free allocation).
After trading at 7,860 KRW (approximately 780 JPY) on the opening day of K-ETS, allowance prices increased yearly, hitting 40,000 KRW (approximately 4,000 JPY) in early 2020—the highest carbon price achieved at that time for any emissions trading scheme globally. According to a South Korean report, prices increased during the first period (2015–17) and second period (2018–20) owing to concern by businesses over insufficient allowance allocations, resulting in their reluctance to put credits on the market, while demand was concurrently rising due to economic expansion and increased production (GIR 2022). Demand then dropped, however, due to the COVID-19 pandemic, which lowered the average price to 18,000 KRW (about 1,800 JPY) in 2021. Prices then rallied to 35,100 KRW (about 3,500 JPY) in January 2022 before falling again. As of this writing, allowances are trading at about 25,000 KRW (about 2,500 JPY).[3]
Figures 2 and 3 compare prices and other basic data for the above-mentioned schemes, along with the California Cap-and Trade Program,[4] the UK Emissions Trading Scheme (UK ETS),[5] the Regional Greenhouse Gas Initiative (RGGI),[6] the New Zealand Emission Trading Scheme (NZ ETS),[7] and the linked cap-and-trade programs of the Tokyo Metropolitan Government and Saitama Prefecture.[8]
Figure 2. Major Emissions Trading Schemes
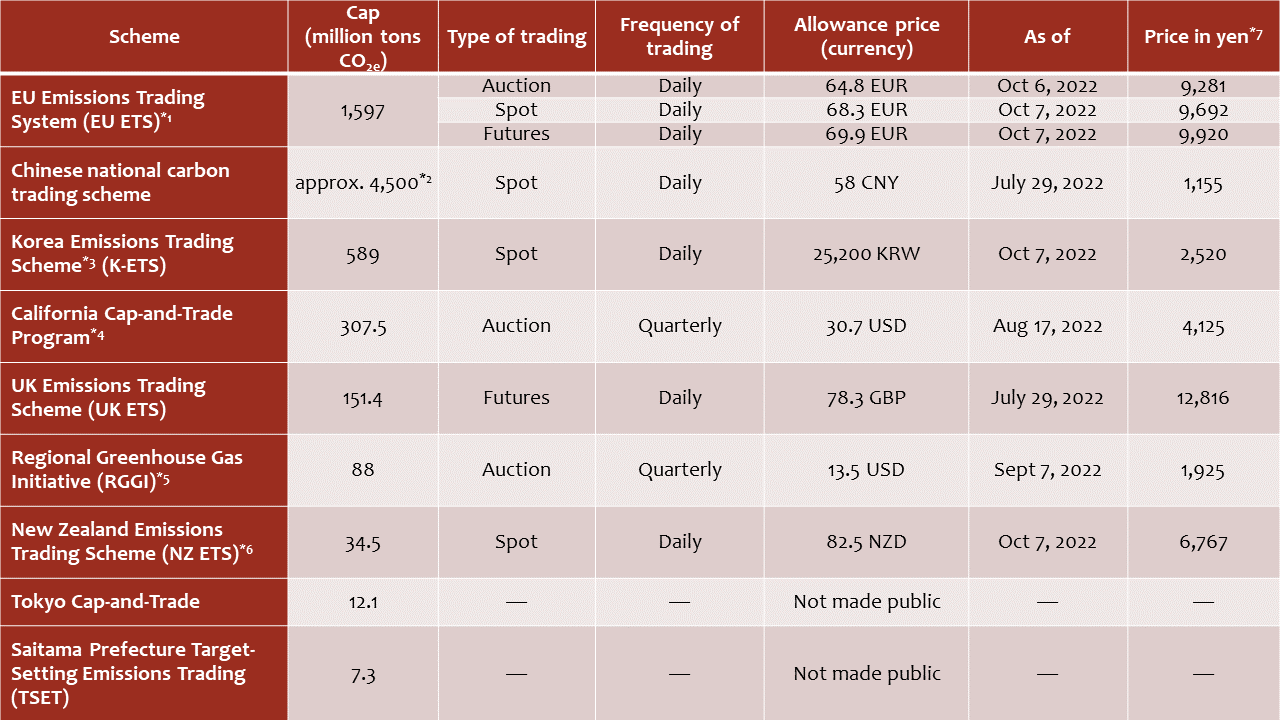
*1 https://www.eex.com/en/market-data/environmentals.
*2 Estimated coverage for 2019 and 2020 (ICAP 2022).
*3 https://ets.krx.co.kr/main/main.jsp.
*4 https://ww2.arb.ca.gov/our-work/programs/cap-and-trade-program/auction-information.
*5 https://www.rggi.org/auctions/auction-results.
*6 Estimated coverage (ICAP 2022).
*7 The following exchange rates were used to convert foreign currencies to yen: 1 CNY = 19.9 JPY (7/29/2022); 1 USD = 143.1 JPY (7/29/2022); 1 USD = 134.3 JPY (8/17/2022); 1 NZD = 82.0 JPY (10/8/2022); 1 KRW = 0.11 JPY (10/7/2022); 1 EUR = 143.3 JPY (10/6/2022); 1 EUR = 142.0 JPY (10/7/2022); 1 GBP = 163.6 JPY (7/29/2022).
Figure 3. Trends in Emission Allowance Prices (as of April 1, 2022)
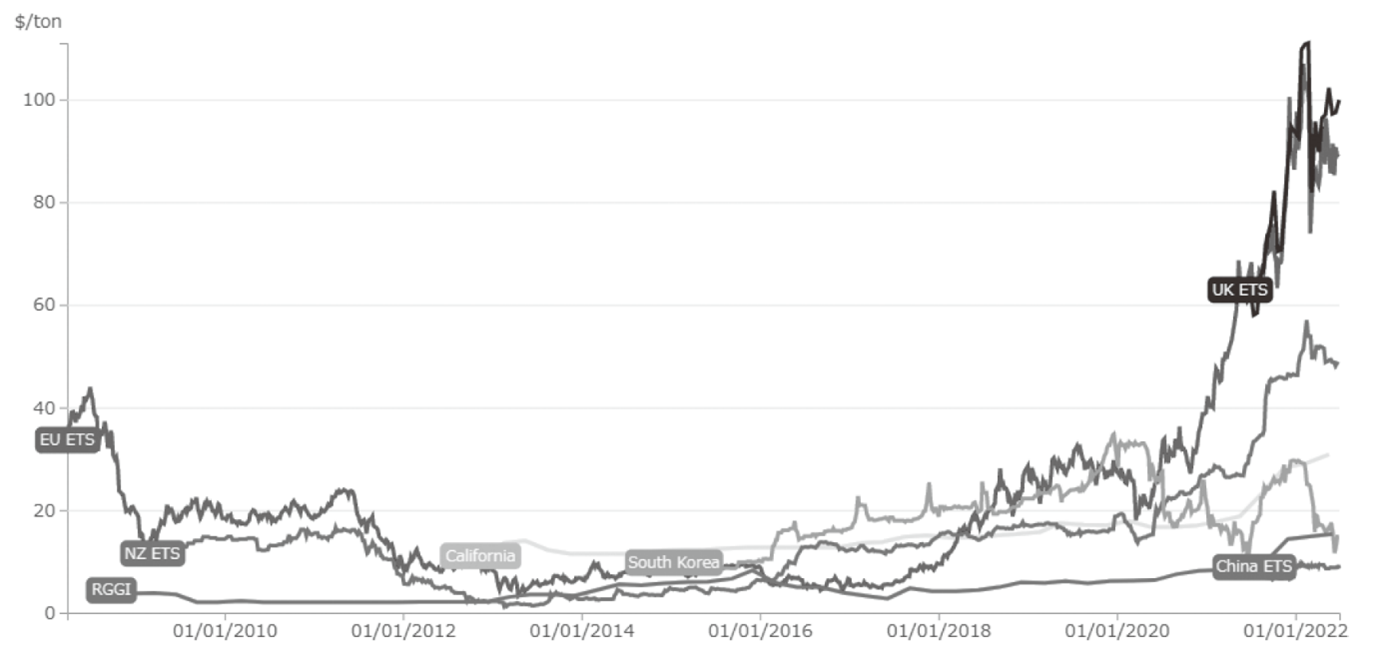
Source: Created by the author using the ICAP Allowance Price Explorer Tool, https://icapcarbonaction.com/en/ets-prices.
Industry’s Response to Carbon Pricing
Businesses are nearing a turning point in their approach to decarbonization. Under carbon pricing, companies are expected to shift from a defensive posture of conventional pollution control to a model of environmental and low-carbon management that generates new value using carbon as an asset.
Growing awareness of ESG (environmental, social, and governance) sustainability criteria is spurring companies to incorporate decarbonization within their business management. A growing number of Japanese corporations have declared their commitment to carbon neutrality (Ministry of Economy, Trade, and Industry 2020), embraced the recommendations of the Task Force on Climate-related Financial Disclosures (TCFD), set their own science-based GHG reduction targets under the SBT initiative, joined the RE100 commitment to 100% renewable energy, or instituted internal carbon pricing (Ministry of the Environment 2021).
In addition to such commitments, companies directly affected by jurisdiction-wide carbon-pricing policies are taking swift and concrete action to tackle the immediate challenges of decarbonization. In the following, I identify and discuss three key features of the response from businesses to these policies, drawing on interviews conducted with executives of South Korean businesses covered by K-ETS (Suk 2020) over many years.
Changing perception of carbon-pricing costs
One fundamental change that occurred after the launch of K-ETS was in businesses’ perception of the costs of carbon pricing. Initially, companies had viewed emissions limits as a liability and compliance measures as additional costs. Companies that succeeded in reducing emissions and costs, however, soon realized that selling surplus allowances on the carbon market enabled them to generate income, reduce debt, and even turn a profit. Such changes in corporate perceptions and behavior can be expected to have a substantial impact in terms of reducing GHG emissions and encouraging further low-carbon investment.
Top-down support for bottom-up initiatives
The introduction of emissions trading schemes has made emissions reduction a key item on corporate agendas, and management’s interest and understanding of carbon pricing has deepened. Dedicated units have been formed, and where necessary, market experts have been brought in from the outside. Teams led by such experts work in a bottom-up manner, developing proactive proposals for decarbonization. With support from top management, these initiatives have often translated into highly effective measures for controlling carbon emissions and navigating the carbon market. Many companies have also developed monitoring systems to stay abreast of fluctuating market prices and adopted decision-making mechanisms adapted to real-time emissions-allowance trading, something initially seen in only a small minority of businesses.
Internalizing and leveraging carbon pricing
A growing number of companies around the world are adopting internal carbon pricing. According to a CDP survey, the practice is most widespread in the manufacturing and energy sectors (fossil fuels, electricity), which are the focus of most emissions trading schemes (CDP 2021). The top reason companies give for internal carbon pricing is that it helps them adapt to the ever-tightening government regulations. But it can also help companies develop and pursue business plans that will yield maximum profits in a low-carbon economy, since it entails quantifying the business risks and opportunities of climate change and identifying the economic costs and benefits of reducing GHG emissions with a variety of climate-change scenarios in mind. In South Korea, the percentage of companies that believe K-ETS has had a positive impact on innovation (new products, new processes, process improvement) and management (including ideas for new business development) is increasing year by year (GIR 2022).
In Conclusion
Businesses in total consume a huge amount of energy and resources and emit large quantities of greenhouse gases in the course of their activities, but they also have a huge capacity for technological innovation. This means that decarbonization management will play a central and ever more important role in efforts to meet humanity’s global climate targets.
Because decarbonization management is essentially about controlling the emission of substances that contribute to global warming, it has much in common with conventional environmental management, which involves controlling pollution through the prevention and treatment of hazardous waste.
In terms of pollution control itself, the corporate response has generally been limited to compliance with laws and regulations established by governments. However, compliance entails costs and does not lead directly to profits. Consequently, environmental management has typically been viewed as conflicting with the core aim of business management—the maximization of profits.
Under carbon pricing, however, carbon is not just a pollutant; it can be traded as a priced asset. The price of carbon is expected to rise in the coming years as governments beef up their policies to meet the Paris Agreement’s global temperature target and their own net-zero commitments. In response, companies therefore need to view carbon as an asset and pursue a form of strategic carbon management that generates both social and corporate value.
Translated from an article originally published in Japanese on Janaury 19, 2023.
References
CDP. 2021. Putting a Price on Carbon: The State of Internal Carbon Pricing by Corporates Globally. Accessed October 7, 2022. https://cdn.cdp.net/cdp-production/cms/reports/documents/000/005/651/original/CDP_Global_Carbon_Price_report_2021.pdf?1618938446.
CPLC (Carbon Pricing Leadership Corporation). 2021. Carbon Pricing Leadership Report 2021/22. https://www.carbonpricingleadership.org/leadershipreports.
GIR (Greenhouse Gas Inventory & Research Center of Korea). 2022. 2020 Korean Emissions Trading System (K-ETS) Report (in Korean).
ICAP (International Carbon Action Partnership). 2022. Emissions Trading Worldwide: 2022 ICAP Status Report. https://icapcarbonaction.com/en/publications/emissions-trading-worldwide-2022-icap-status-report.
Liu, X., and T. Murun. 2022. “Carbon Pricing for the Transition Toward Net-zero of Asia.” Working Paper, Institute for Global Environmental Strategies. https://www.iges.or.jp/en/pub/cp-asia/en.
Kojima, S., et al. 2018. Choki teitanso bijon jitsugen ni muketa gurin zeisei kaikaku teian: Bakkukyasutingu ni motozuku seisaku hyoka no tekiyo (Proposal for Green Tax Reform to Realize a Long-term Low-Carbon Vision: Application of a Policy-Assessment Method Based on Backcasting). Kankyo Keizai Seisaku Kenkyu 11-2: 82-86. Accessed October 7, 2022. https://www.jstage.jst.go.jp/article/reeps/11/2/11_82/_pdf.
Kuriyama, K., and S. Managi. 2020. Kankyo keizaigaku o tsukamu (Understanding Environmental Economics). 4th Edition. Tokyo: Yuhikaku Publishing.
Ministry of Economy, Trade, and Industry. 2020. 2050 nen kabon nyutoraru o meguru kokunaigai no ugoki (Domestic and International Trends Pertaining to Carbon Neutrality in 2050). Accessed November 14, 2022. https://www.meti.go.jp/shingikai/sankoshin/sangyo_gijutsu/chikyu_kankyo/ondanka_wg/pdf/002_03_00.pdf.
Ministry of the Environment. 2021. “List of companies working on TCFD, SBT, and RE100” (as of July 31, 2021). Accessed November 14, 2022. https://www.env.go.jp/earth/ondanka/datsutansokeiei/datsutansokeiei_mat01_2021073 1.pdf.
Parry, I., S. Black, and J. Roaf. 2021. “Proposal for an International Carbon Price Floor Among Large Emitters.” Staff Climate Notes, June 18, 2021, International Monetary Fund. https://www.imf.org/en/Topics/climate-change/staff-climate-notes#:~:text=June%2018%2C%202021,a%20half%20in%20this%20decade.
Rogelj, J.D., et al. 2018. “Mitigation Pathways Compatible with 1.5°C in the Context of Sustainable Development.” In Global Warming of 1.5°C: IPCC Special Report on the Impacts of Global Warming of 1.5°C above Pre-industrial Levels in Context of Strengthening Response to Climate Change, Sustainable Development, and Efforts to Eradicate Poverty. Cambridge: Cambridge University Press. Accessed November 14, 2022. https://doi.org/10.1017/9781009157940.004.
Stavins, R.N. 2022. “The Relative Merits of Carbon Pricing Instruments: Taxes versus Trading.” Review of Environmental Economics and Policy 16-1: 1-21.
Suk, S.H. 2020. “Kankoku onshitsu koka gasu haishutsuryo torihiki seido no daiikki oyobi dainiki no un’ei doko” (Emission Trading Scheme in South Korea during First and Second Phase). Discussion Paper 20, Research Project on Renewable Energy Economics, Graduate School of Economics, Kyoto University. Accessed November 14, 2022. https://www.econ.kyoto-u.ac.jp/renewable_energy/stage2/contents/dp020.html.
Suk, S.H. 2021. “South Korea’s Emission Trading Scheme and Company Carbon Management in the First Phase (2015-2017).” Discussion Paper 34, Research Project on Renewable Energy Economics, Graduate School of Economics, Kyoto University. https://www.econ.kyoto-u.ac.jp/renewable_energy/stage2/contents/dp034.html.
Suk, S.H., et al. 2022. “Carbon Market Linkage of China, Japan, and Korea and Its Decarbonization Impact on Economy and Environment: E3ME Application Case Study.” Materials presented to the 11th Congress of the Asian Association of Environmental and Resource Economics, Ho Chi Minh City, August 12, 2022.
World Bank. 2022. State and Trends of Carbon Pricing 2022. Accessed November 14, 2022. https://openknowledge.worldbank.org/handle/10986/37455.
[1] EEA website, Emissions, Allowances, Surplus, and Prices in the EU ETS, 2005-2020, https://www.eea.europa.eu/data-and-maps/figures/emissions-allowances-surplus-and-prices (October 7, 2022).
[2] EEX website, https://www.eex.com/en/market-data/environmentals (7 October 2022).
[3] KRX website, https://ets.krx.co. kr/main/main.jsp.
[4] California auctions allowances four times a year to the power, industrial, and fuel-distribution sectors in a program that is linked with the Canadian province of Quebec.
[5] Britain launched its own emissions trading scheme in 2021 to replace the EU ETS following Brexit. It applies to energy-intensive industries as well as the power and aviation sectors.
[6] RGGI is cooperative, market-based effort among 11 US states to cap and reduce regional CO2 emissions from the power sector. It applies to fossil-fuel-powered plants of 25 megawatts, and all allowances are auctioned.
[7] The New Zealand ETS applies to all sectors, including forestry, energy, transport, industrial processes, and agriculture.
[8] The Tokyo and Saitama cap-and-trade programs, launched in 2010 and 2011, respectively, cover local buildings, factories, and other facilities.
![]()
Subscribe to the Tokyo Foundation for Policy Research eNewsletter.
