As Japan prepares to enter into negotiations for an expanded Trans-Pacific Partnership, debate is raging over the benefits and dangers of participation in such a comprehensive free trade agreement.
Some have warned that free trade in farm products would devastate Japan’s farm sector. Others argue that Japanese agriculture has been declining despite generous government support and protection, and that participation in the TPP will provide an impetus for long-overdue structural reforms. To assess the merits of these positions, we must begin with an objective assessment of the state of Japanese agriculture today.
Japanese Agriculture at a Glance
As of 2007 the value of gross agricultural production in Japan (agricultural receipts less such costs as machinery, fertilizer, and pesticides) was 5.3 trillion yen. [1] Agricultural imports were valued at 4.8 trillion yen, while the agriculture, forestry, and fisheries budget (the bulk of which goes to the farm sector) was 2.3 trillion yen. Revenues from agricultural tariffs totaled approximately 500 billion yen. [2]
According to figures published by the Organization for Economic Cooperation and Development, prices of farm produce in Japan are 56% higher than the world average. [3] On the basis of the foregoing figures, Japan’s food self-sufficiency by value (domestic production divided by the sum of domestic production and import volume) is approximately 50%. (The more commonly cited rate of 40% is calculated on the basis of calories.)
Figure 1. Economic Overview of Japanese Agriculture
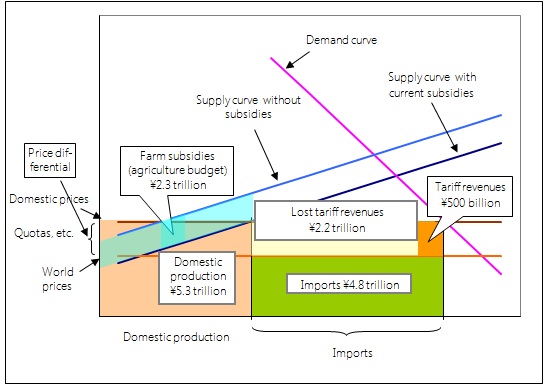
Figure 1 is a schematic representation of the state of Japanese agriculture based on these statistics. The chart reveals the role that government protection plays in sustaining current levels of domestic production and self-sufficiency. Underlying the 5.3 trillion yen in agricultural production are programs costing 4.2 trillion yen—including 2.3 trillion yen in subsidies and price supports (including import quotas) equivalent to 1.9 trillion yen (5.3 trillion yen × 0.56 ÷ 1.56)—which have the effect of shifting the supply curve as illustrated in the diagram. If we subtract this 4.2 trillion yen from the current value of domestic production, we are left with just slightly more than 1 trillion yen.
What this means is that Japanese agriculture is being sustained with measures amounting to 4.2 trillion yen so that the sector can create 5.2 trillion yen in added value. Given that farm imports total 4.8 trillion yen and prices in Japan are 56% higher than the world average, tariffs should normally produce revenues of 2.7 trillion yen (4.8 trillion yen × 0.56). Adding this to the 1.9 trillion yen in subsidies and price supports gives 4.6 trillion yen, which is the price Japanese consumers are paying to maintain the current agricultural system. Tariff revenues, though, are only 500 billion yen. Obviously, something is not quite right.
For some, the fact that domestic production today would drop from 5.3 trillion yen to 1 trillion yen in the absence of supports validates the claim that liberalization of farm imports would destroy Japanese agriculture. But the fact is that many segments of Japan’s agriculture industry are getting along with virtually no protection.
Levels of protection vary widely by commodity. Imports of soybeans and corn are subject to no tariff whatsoever, and tariffs on vegetables range between 3% and 9%. By contrast, Japan levies tariffs of 20% on processing tomatoes, 20%–40% on oranges, 38.5% on beef, 218% on powdered milk, 234% on potato starch, 252% on wheat, 328% on sugar, 360% on butter, 583% on tapioca starch, 778% on rice, and 1,700% on konjac ( konnyaku imo ).
To be sure, some subsectors of the Japanese farm industry are protected precisely because they are structurally incapable of raising productivity to international levels. But in other cases the cause-and-effect relationship is certainly the opposite—protective policies are discouraging the reforms needed for domestic producers to stand on their own.
Large Farms in Japan
Figure 2 shows total domestic production in each segment broken down by the scale of operations, as measured by receipts. In the category of broiler chickens, for example, farm entities with annual receipts of 10 million yen or more account for 98.1% of total annual production in Japan. Other segments that rely heavily on large-scale operations include eggs, pork, and dairy; farms earning 10 million yen or more account for at least 97% of total production in each of these sectors.
Figure 2. Share of Production by Farm Scale (in receipts)
(¥ million)
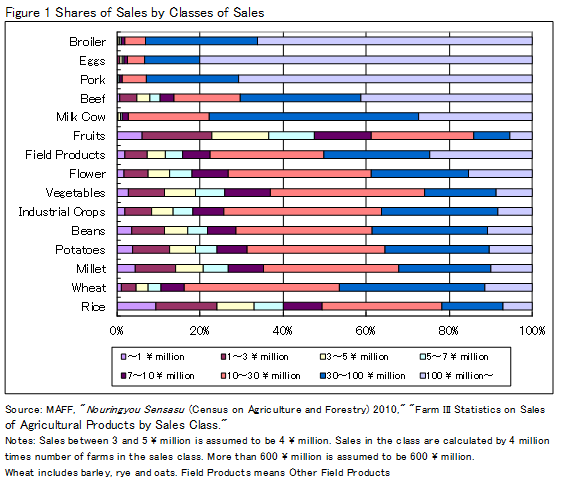
Note: Total receipts in each farm class are calculated by multiplying the number of farms in that class by the range of receipts (for example, for the ¥300–¥500 million class, the range would be ¥200 million).
In the vegetable, rice, and fruit segments, by contrast, farms earning 10 million or more account for a much smaller share of production: 63.0%, 50.5%, and 38.8%, respectively. Between these two extremes we find (from high to low) beef, wheat and barley, other crops, industrial crops, flowers, soybeans, potatoes and tubers, and miscellaneous cereals. Although rice cultivation lends itself to large-scale farming, protection and support have allowed small farms to continue operating in large numbers.
In the case of fruits and vegetables, which tend to be labor intensive, the difficulty of securing adequate labor (especially given the limited supply of immigrant and migrant workers in Japan) probably limits the scale of farming. Even here, however, farm consolidation would surely progress more rapidly were it not for government protection and regulation.
Moreover, the Census of Agriculture conducted by the Ministry of Agriculture, Forestry, and Fisheries reveals that consolidation has occurred even in some of Japan’s more regulated and protected sectors. In other words, while many part-time farmers continue to cultivate small plots, the bulk of production is shifting to large-scale farms.
When it comes to grains, Japan is at a disadvantage compared with land-rich countries like the United States and Canada. But we need to keep in mind that the real issue is not land area per capita but agricultural acreage per farm. If the number of farms decreases, the acreage per farm grows. One reason farm consolidation has progressed so rapidly in the United States is that so many farmers and farmers’ children have migrated to the cities.
By the same token, the reason average farm acreage is so low in Japan is that the government has elected to keep the population of farmers high for political reasons. Out of a total of 2.53 million farming households in Japan, only 440,000 are engaged in agriculture on a full-time basis. The total acreage of farmland in Japan is about 4.6 million hectares, which calculates to an average of just 1.8 hectares per farm. If the total acreage was divided among full-time farmers only, the average would soar to 10.4 hectares.
According to statistics compiled by the Food and Agriculture Organization (whose definitions differ from those used by MAFF), Japan has 2.6 hectares of agricultural land for each person economically active in agriculture. In this area Japan cannot compare with the United States (63.8 hectares), Australia (99.4), or Canada (132.3), but it compares favorably with China (0.2) and South Korea (1.2), and it should be capable of competing with European countries like Germany (4.2), the Netherlands (4.7), France (7.3), and Italy (7.8).
How Europe Does It
On average, European farms are much smaller in scale than their New World counterparts, and yet European nations play an important role in agricultural trade. Figure 3 charts the total volume and makeup of agricultural exports from 20 major exporting nations, plus South Korea and Japan. Of the top 10 exporters, 6 are European nations.
Figure 3. Volume and Commodity Breakdown of Agricultural Exports by Country, 2008
($ billion)
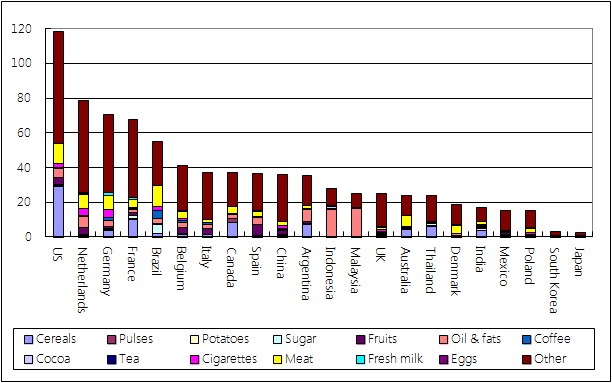
Figure 4 shows the volume and breakdown of agricultural imports by 20 major agricultural importers, plus South Korea and Japan. Of the top 10 importers, 7 are also top exporters, and 6 of those 7 are European countries. (The seventh is the United States.)
Figure 4. Volume and Commodity Breakdown of Agricultural Imports by Country, 2008
($ billion)
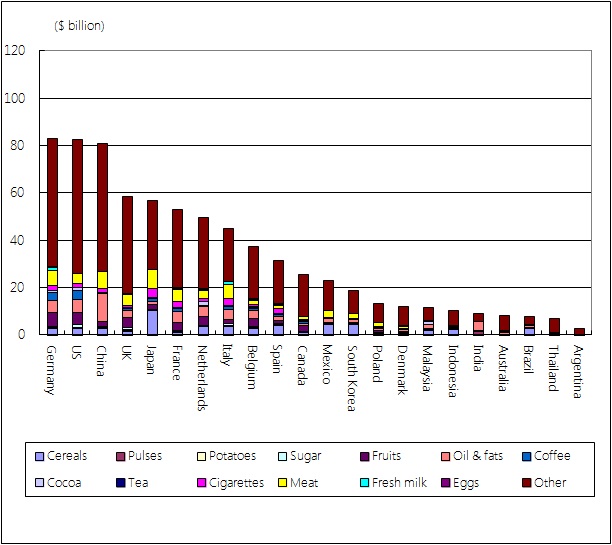
Belgium and the Netherlands are of particular interest in this context. How do these tiny countries export and import so much? What are they importing and exporting?
Figures 5, 6, and 7 chart the top 20 agricultural exports of the Netherlands, Belgium, and Japan.
Figure 5. The Netherlands’ Top Agricultural Exports, 2009
($ million)
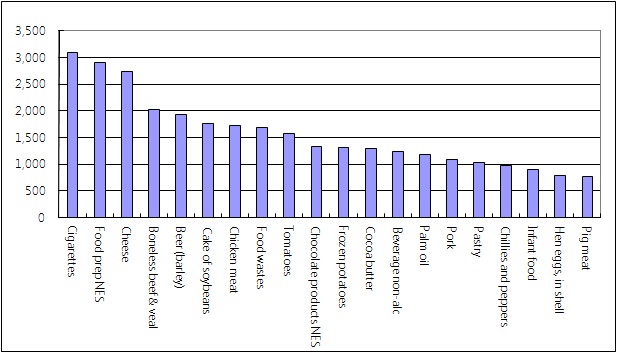
Figure 6. Belgium’s Top Agricultural Exports, 2009
($ million)
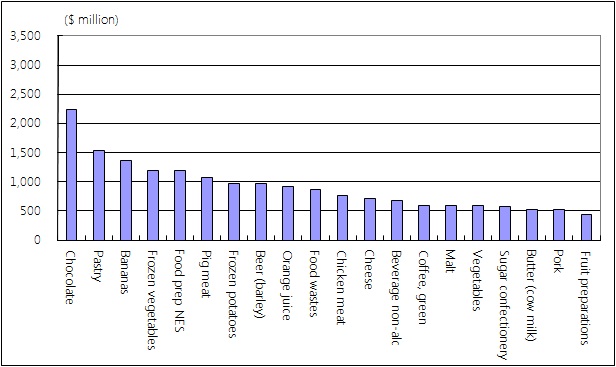
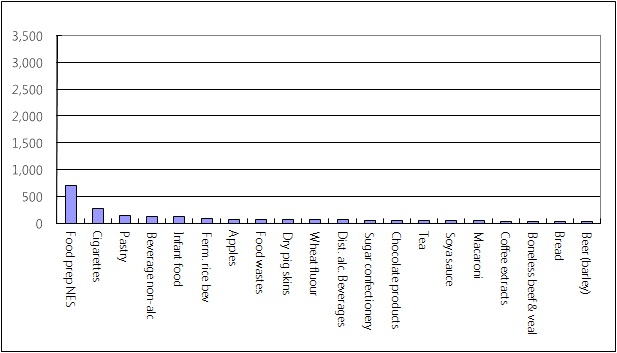
Figure 7. Japan’s Top Agricultural Exports, 2009
($ million)
As we see, the top five agricultural commodities exported from the Netherlands are cigarettes, (other) processed foods, cheese from whole milk, boneless beef and veal, and beer made from barley. The top five Belgian exports, as seen in Figure 6, are chocolate and chocolate products, sugar confectionery, bananas, frozen vegetables, and (other) processed foods. Needless to say, neither cocoa nor bananas are grown in Belgium; they are imported, processed, and then exported as processed foodstuffs.
Processing is something at which Japan is quite adept as well; indeed, the top five farm exports are processed foods, cigarettes, confectionery, nonalcoholic beverages, and baby food (Figure 7). But the volume of those exports is small compared with those of countries like Belgium and the Netherlands. Whereas the Netherlands exports $2.9 billion worth of processed foods, Japan’s exports in that category total a mere $700 million. Figures 5, 6, and 7 reveal the gap between Japan and these tiny European countries in the area of food exports.
It seems odd that Japan—a gastronomic paradise that now boasts more Michelin three-star restaurants stars than any other country in the world—falls so far short in the export of food preparations. One of the biggest factors limiting the development of Japan’s food export industry is surely the high cost of raw ingredients—a result of import quotas and other trade barriers designed to protect domestic producers.
MAFF, which has championed such protection over the years, recently estimated that lifting tariffs on 19 agricultural products (including rice, wheat, sugar crops and sweeteners, dairy products, beef, pork, chicken, and eggs) would cause domestic production to fall by 4.1 trillion yen and would cost the Japanese economy 7.9 trillion yen, owing to the ripple effect on related industries. [4] It is difficult to fathom, though, why access to cheaper imported ingredients would have such an effect on overall GDP. Apparently it has never occurred to MAFF that liberalization of agricultural imports could aid the development of the food industry.
Are Processed Foods Farm Exports?
Some may question whether processed foods should be considered agricultural exports in the first place, but the FAO and MAFF both regard them as such. MAFF’s own trade statistics, which include marine products, identify Japan’s top five agricultural export commodities as cigarettes, seasoning sauces, salmon and trout (fresh, preserved, and frozen), alcoholic beverages, and pearls (natural and cultured).
But does it make sense to include processed foods as agricultural commodities? That depends on one’s view of agricultural protection and its purpose. The three rationales commonly adduced for protecting agriculture are food security (ensuring a stable food supply in the event that imports are disrupted), supporting local economies, and protecting the environment. With respect to the first two rationales, including processed foods in one’s trade calculations makes good sense.
First, having food companies maintain a stock of processed foods is a cheaper way of ensuring food security than entrusting this task to the government. Second, if one is importing primary agricultural products and processing them into food preparations for export, this means one is importing more of those products than is needed for domestic consumption; therefore, a drop in imports will not jeopardize food security, provided that the decrease is within that margin.
As for local economies, the processed food industry clearly has an important role to play. If local produce is used in the processing, then the economy benefits from the value added. But even if imported ingredients are used, the industry can provide jobs and income to sustain the local economy.
Conclusion
The first thing we need to recognize is that Japan’s current agricultural policy has been less than a success. If the goal of protection is to give domestic industry a chance to develop and stand on its own feet, then the protection of Japan’s farm industry has failed in its purpose.
But this, in fact, has not been the government’s goal. For agriculture to stand on its own would require improvements in farm productivity, which naturally results in fewer people employed in the farm sector. This would have weakened the political power of the rural districts that constituted the Liberal Democratic Party’s most important political base during its years in power. Consequently, the government did almost nothing to encourage farm consolidation.
Even so, large-scale operations have come to occupy the bulk of production in many segments thanks to the initiative of people determined to make farming a more profitable business. By leveraging this power, we should be able to build a more productive farm sector in Japan.
To those who object that this trend will depopulate Japan’s rural communities, I would counter that the development of the food processing industry would create job opportunities for former farmers. We should follow the lead of European nations that have introduced large-scale farming while maintaining the population in the agriculture sector by having more people work in food-related industries.
The fact that a few large-scale farm operations now account for the bulk of production in many Japanese agricultural segments argues for a fundamental shift in Japanese farm policy. The subsidies for individual farming households introduced by the Democratic Party of Japan are regarded as being counterproductive, since they support small farms and discourage farm consolidation. Yet, DPJ administrations have been loath to risk a political backlash by abolishing the scheme.
If, on the other hand, these subsidies were allocated according to production volume, they would cease to act as a disincentive to consolidation. In the rice subsector, for example, 67% of income compensation would go to farms with annual receipts of 5 million yen or more (based on the values in Figure 2). In most other subsectors, the ratio would be in excess of 80%. Some purists will protest that the remaining 20% would be a wasteful use of public funds, and so it would be. But it seems a relatively small price to pay, given the magnitude of the waste perpetrated by Japan’s counterproductive agricultural policies over the years.
[1] In this article the term agriculture excludes forestry and fisheries, unless otherwise noted.
[2] According to data submitted at the fourth general meeting of the Council on Customs, Tariff, Foreign Exchange and Other Transactions, April 20, 2007、http://www.mof.go.jp/about_mof/councils/customs_foreign_exchange/soukai/proceedings/material/a190420.htm.
[3] OECD, Producer and Consumer Support Estimates 2010 , http://www.oecd-ilibrary.org/agriculture-and-food/data/producer-and-consumer-support-estimates_agr-pcse-data-en.
