Despite a steadily growing economy, the promised trickle-down effect has yet to materialize, with newly created wealth being amassed mainly by those who already hold substantial financial assets. Economist Takashi Oshio calls for a reexamination of tax and other policies to distribute the benefits of Abenomics more evenly throughout society.
* * *
Prime Minister Shinzo Abe launched his Abenomics growth strategy upon entering office five years ago, since which time the Japanese economy has generally been expanding, save for a brief period following the April 2014 hike in the consumption tax. And while the reflationist vision of quantitative easing leading to inflation and robust growth has yet to materialize, Abenomics has, by most measures, been a success.
Some will argue, though, that while the economy as a whole has been growing, this has come at the expense of widening income gaps among householdsーa claim that appears unfounded when checked against government statistics. For example, there are two indices for the Gini coefficient: the survey on the redistribution of income undertaken by the Ministry of Health, Labor, and Welfare and the national survey of family income and expenditure conducted by the Ministry of Internal Affairs and Communications. Looking at the results published in 2014 (surveys conducted in January-December 2013 and December 2013-November 2014, respectively), the former shows a slight decline in the Gini coefficient from the 2011 figure of 0.3791 to 0.3759, while the latter similarly retreated from 0.283 in 2009 to 0.281.
I would hesitate to draw a conclusion about income disparities based on a single index, such as the Gini coefficient, however. That is because such figures do not adequately account for key background factors that give rise to inequalities. That said, judging from major indicators, there does not appear to be any statistical evidence that wage gaps are widening.
Where Is the Wealth Accumulating?
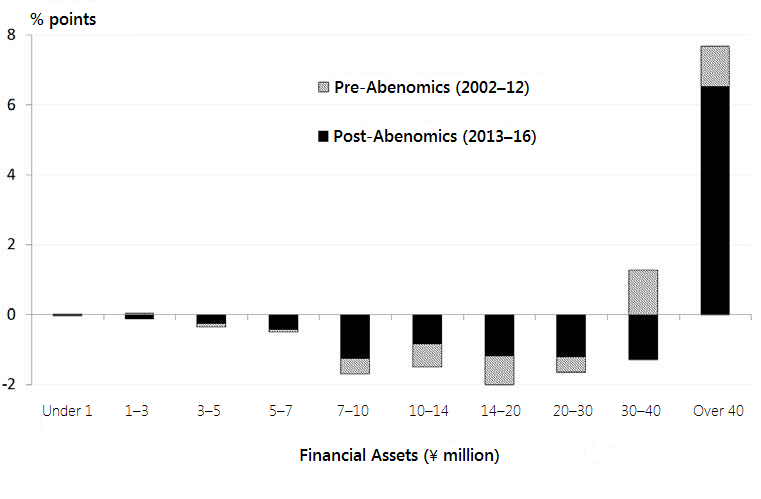
Is the feeling of growing differentials, then, just a figment of our imagination? Not quite, it turns out, if we look at figures not for “flow” (like income) but for “stock” (such as household savings). Let us examine the changes in the distribution of deposits, securities, and other financial assets since the advent of Abenomics. One useful source is the section on the savings and liabilities of two-or-more-person households in the abovementioned family income and expenditure survey containing data as recent as 2016. Households are classified into 10 groups based on their financial assets, ranging from “under ¥1 million” to “¥40 million and over.” The figure below charts the changes in each group’s share of the total before and after Abenomics by comparing the averages for 2002-12 and 2013-16.
The point to note here is not the relative rise or decline in the number of households per group but the change in each group’s “asset strength”ーexpressed as average savings multiplied by number of households. This will help to elucidate whether or not wealth in Japan is becoming concentrated in the hands of the super-rich, as is the case in many Western countries.
The figure shows that in the decade before Abenomics, the asset strength of households in the two wealthiest categories rose as a share of the total, but only by a little over 1 percentage point. The strength of the eight other groups, meanwhile, declined during the same span, but also by similarly minimal margins. In the post-Abenomics era, though, the most affluent group saw a substantial surge in its strength; whereas it rose by just 1.2 points before Abenomics, it jumped by 6.5 points in the ensuing four-year period. Also noteworthy is the fact that the strength of all other groups declined. This is clearly the result of the bull market unleashed by Abenomics (as the value of shares included in the family income and expenditure survey is based on market prices as of the time of the survey).
Change in Share of Asset Strength by Wealth Level
The Rich Get Richer
This data may be interpreted in a number of ways; it can be seen as corroborating the positive repercussions of Abenomicsーthat more households have joined ranks of the very rich. But is such an assertion justified? Let us take a closer look, comparing families with over ¥40 million in household savings and those with less than ¥40 million.
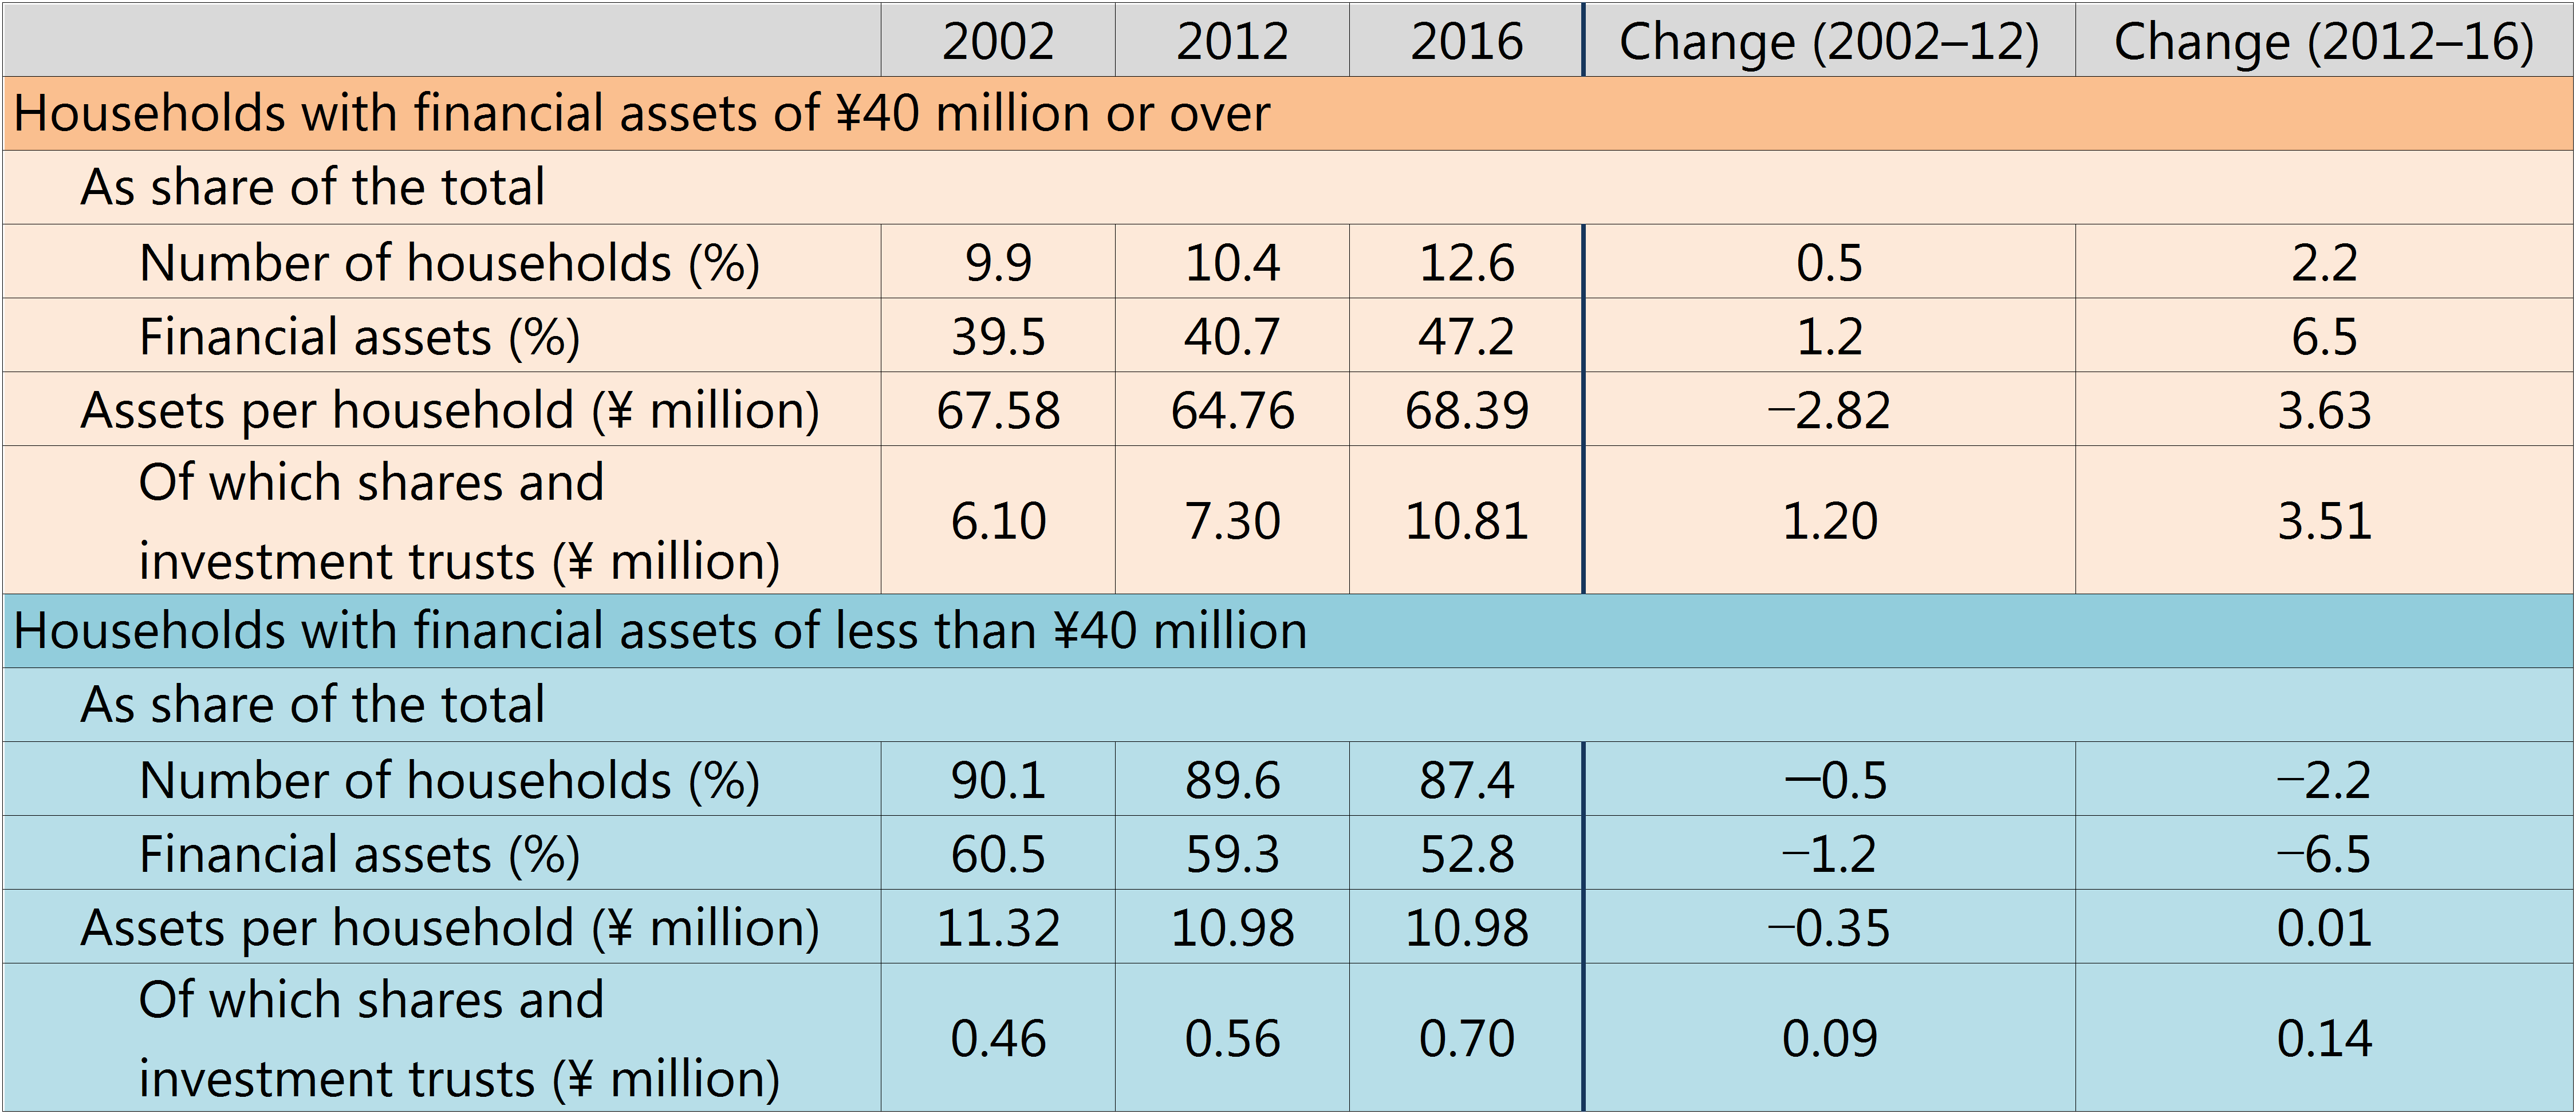
The table below shows that as a share of all households, the ¥40-million-plus group expanded by 2.2 points, from 10.4% in 2012 to 12.6% in 2016. The “asset strength” of this group swelled by 6.5 points, though, as described above, so an increase in the number of households alone cannot account for this sector’s stronger position. This suggests that the households already belonging to the top echelon saw their wealth expand. Indeed, while assets held by this group declined during the 10 pre-Abenomics years by ¥2.82 million (from ¥67.58 million to ¥64.76 million), they grew by ¥3.63 million (to ¥68.39) in the four years since the launch of Abenomicsーa figure roughly in line with the ¥3.51 million rise in their holding of shares and investment trusts over the same period.
Households with financial assets of less than ¥40 million, on the other hand, saw their average savings remain basically unchanged at ¥10.98 million during the four years of Abenomics, being consigned to watching wealthier families grow even richer.
Abenomics’ Impact on the Assets of the Wealthiest and Other Families
Using Taxes to Redistribute Benefits
Abenomics thus appears to have had the effect of making wealthy families even wealthier while doing little to enhance the financial assets of the less affluent.
Economics textbooks generally condone such developments as indicating a Pareto improvement, but policymakers should nonetheless keep in mind that people not among the beneficiaries will think it is unfair for a small group of families to reap all the riches over a short period of time.
The discussion above is admittedly rather simplistic; a more meticulous argument should consider that (1) older households will generally have bigger savings, (2) older households will also be marked by wider wealth gaps, (3) real estate and other physical assets were not included in the analysis, (4) single-person households were also excluded, and (5) the share of total assets held as securities and other risky instruments in Japan is relatively low.
The fundamental thrust of this articleーthat wealth seems to be concentrating increasingly in a narrow segment of societyーshould remain valid even when a fuller range of statistics is examined, though, especially as rising share prices can largely account for the bump in asset values. The implications of this are that the vast majority of people have yet to reap the benefits of Abenomics. Inasmuch as the stated goal of the growth strategy is to create a virtuous cycle of higher growth and income throughout society, a review of the policies implemented thus farーincluding tax policiesーis in order.
Translated from “Abenomikusu de susumu tomi no shuchu,” Chapter 1 of the Tokyo Foundation Policy Research report examining the use of ICT in tax and social security reform, published in November 2017.
-
-
- Professor, Institute of Economic Research, Hitotsubashi University
- Takashi Oshio
- Takashi Oshio
-

Featured Content
-
Funding the Policies to Boost Japan’s Birthrate
Funding the Policies to Boost Japan’s Birthrate
-
Agar
Agar
-
CSR in Japan: Unique Features and Recent Trends
CSR in Japan: Unique Features and Recent Trends
-
Japanese Honeybee
Japanese Honeybee
-
How Will the Economic Security Law Change Japan’s Sci-Tech Policy?
How Will the Economic Security Law Change Japan’s Sci-Tech Policy?
